A wearable validation study asks one question: when this device and a trusted reference measure the same person at the same moment, how far apart are the two numbers? Everything else, from the choice of statistic to the number of participants, decides how much that answer is worth. Four things carry most of the weight: what the device was compared against, which error statistic was reported, whether the authors looked at agreement or only at correlation, and who was tested, how many, and where.
Start with the reference
A study is only as good as its reference, which researchers call the criterion measure. For each quantity a wearable reports, there is an accepted benchmark:
- Heart rate: an electrocardiogram (ECG), or an electrode chest strap that has itself been checked against one.
- Beat-to-beat intervals: the raw ECG trace, sometimes inspected by eye.
- Sleep stages: polysomnography (PSG), the all-night sleep-lab recording of brain waves, eye movement and muscle tone, scored by trained technicians.
- Steps: direct observation, meaning a person with a hand tally counter or a video recorded at the feet and counted afterwards.
- Blood oxygen: oxygen saturation measured in an arterial blood sample by a laboratory co-oximeter.
When a study compares one wearable against another wearable, it is measuring agreement between two estimates, not accuracy. That can still be useful, but it is a weaker claim. The INTERLIVE Network, a European consortium of universities and one industry partner, published expert checklists for heart-rate and step-count validation in 2021. Both organize a good study around the same six domains: the target population, the criterion measure, the index (tested) device, the testing conditions, data processing, and the statistical analysis [2][3].
The Polar H10 chest strap in our cabinet is an example of a device that often sits in the reference column. A Swiss study of 10 healthy adults found it captured 99.6% of beat-to-beat intervals correctly across five activities, judged against visual inspection of the raw ECG [5]. That is why studies borrow it as a stand-in for an ECG. Note the sample size, though: ten people.
The error statistics: MAPE, bias and their cousins
Most accuracy numbers you will see are one of a small family.
- Mean absolute error (MAE) is the average size of the gap between device and reference, ignoring direction, in the original units (for example, bpm).
- Mean absolute percentage error (MAPE) is the same idea expressed as a percentage of the reference value. It lets you compare a heart-rate result with a step-count result. Lower is better.
- Mean bias (also called mean difference, or mean percentage error when expressed in percent) keeps the sign. A bias of −3 bpm means the device read low on average.
The difference between MAPE and bias matters. A device that reads 10% high half the time and 10% low the other half has a bias near zero and a MAPE near 10%. The bias says the device is not systematically off; the MAPE says any single reading can be well off. A report that gives only the bias can make a scattered device look excellent.
Statistics are also reported at different levels: per reading, per minute, per session or per person. An error averaged over a 30-minute session hides the second-by-second swings a user actually sees on the screen. Check what unit the average was taken over.
Agreement, not correlation: the Bland-Altman plot
In 1986, two statisticians published a short paper in The Lancet that still governs this field. Its argument: a high correlation between two methods does not show that they agree [1]. Correlation measures whether two numbers rise and fall together, not whether they are the same. A device that always reads exactly 20 bpm high correlates perfectly with the reference and is still wrong by 20 bpm every time. Correlation also rises simply when the study includes a wide range of values, such as resting and sprinting heart rates in the same dataset.
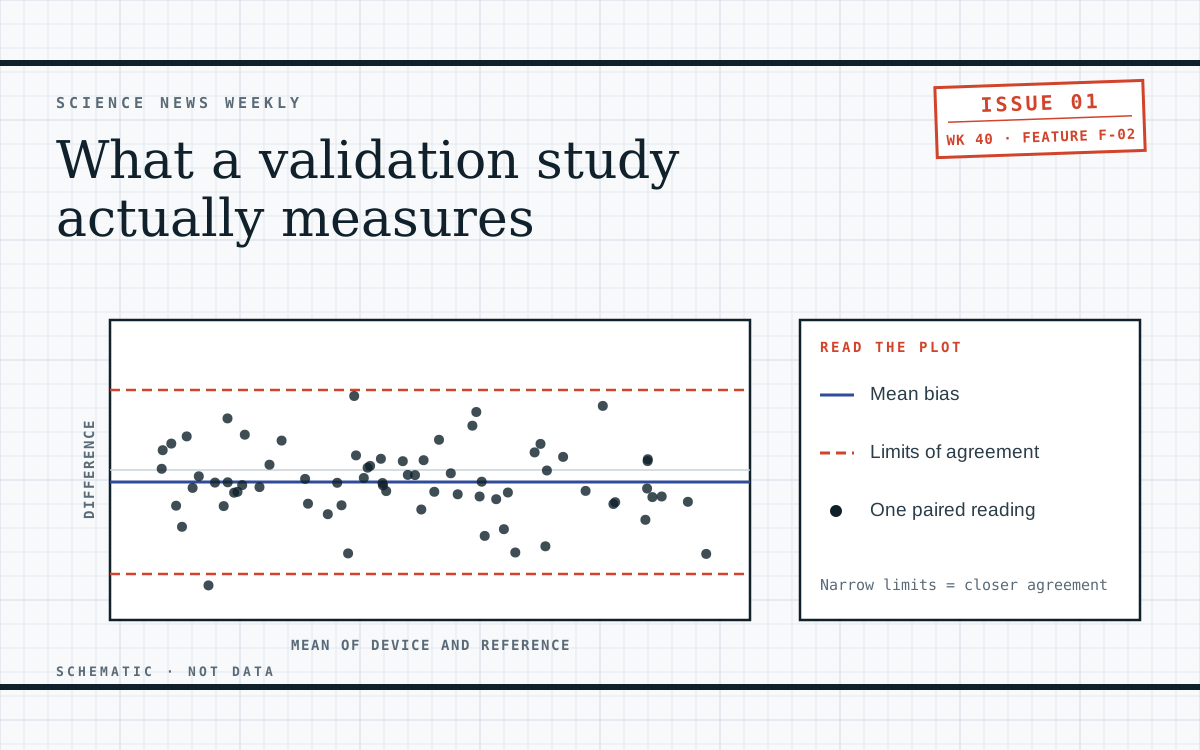
Their alternative is now called the Bland-Altman plot, and it is the chart on this feature's cover. For each paired reading, the horizontal axis shows the average of device and reference, and the vertical axis shows the difference between them. Here is how to read one.
Find the center line
The solid horizontal line is the mean bias. If it sits above zero, the device reads high on average; below zero, it reads low.
Find the dashed lines
These are the 95% limits of agreement: the bias plus or minus about two standard deviations of the differences (1.96 in most modern papers). Roughly 95% of individual differences are expected to fall between them.
Judge the width in real units
Ask whether a gap as large as the limits would matter for what you use the number for. Limits of ±4 bpm and limits of ±20 bpm can come with the same small bias.
Look for a slope or a funnel
If the dots drift up or down from left to right, the error depends on the level being measured, for example growing at high heart rates. A funnel shape means the scatter widens as values rise.
Check what each dot is
One dot per person, per minute, or per 30-second epoch changes how much weight a single participant carries. The methods section should say.
Some studies report Lin's concordance correlation coefficient (rc), which, unlike an ordinary correlation, is pulled down by a systematic offset. It is a better single number than Pearson's r, but a plot of the differences still tells you more.
A worked example: sleep staging and the accuracy trap
Sleep studies add another layer, because the device and the sleep lab both label every 30-second slice of the night (an epoch) and the labels are compared one by one. A 2021 framework paper in Sleep set out standard steps for this: discrepancy analysis of summary measures, Bland-Altman plots, and epoch-by-epoch comparison, with open-source code [4].
A 2024 study in Sleep Medicine compared the Oura Ring Generation 3 with multi-night ambulatory polysomnography in 96 generally healthy adults aged 20–70, covering 421,045 epochs. Sensitivity for sleep was 94.4–94.5%, but specificity (correctly labeling wake) was 73.0–74.6%, while overall epoch accuracy was 91.7–91.8%. Three authors reported financial support from Oura Health. The study tested the Gen3 ring, not the Ring 4. Sleep Medicine, 2024 [6].
This result shows why a single “accuracy” percentage can flatter a device. Most epochs of a night are sleep. A tracker that labels nearly everything as sleep will score high overall accuracy while missing a good share of the time the person was actually awake. The specificity figure is where that shows up. When you see a sleep tracker's accuracy claim, look for sensitivity and specificity reported separately, and for agreement statistics on each sleep stage.
The same example illustrates funding. Industry-supported studies are common and are not automatically wrong, especially when peer-reviewed and fully reported. But a funding line belongs next to the result, which is why our accuracy strips note it.
Who was tested, how many, and where
Even a well-analyzed study describes a particular group of people doing particular things.
- Sample size. Ten participants can show that a device works in principle; they cannot map out how it behaves across ages, skin tones and body types. Check the number of people, not just the number of readings.
- Population. Most validation studies recruit healthy adults. A result from young volunteers may not carry over to other groups.
- Lab versus free-living. Treadmill protocols are controlled and repeatable, but real life includes typing, carrying bags and stop-start movement. The INTERLIVE step-count statement highlights the need to develop feasible gold-standard references for free-living validation [3]; until then, most tightly controlled results come from the lab.
- Model and firmware. A result belongs to the hardware and software version tested. Wearables are updated often, and an earlier generation's result is not the current model's.
- Publication. A peer-reviewed paper with a methods section can be checked. A figure on a product page or in a press release usually cannot.
How to read our accuracy strip
Each instrument entry on this site carries an accuracy strip: one cell per published result. The color says who produced it. Blue cells are independent peer-reviewed studies (with any manufacturer funding noted). Oxide cells come from the manufacturer or a regulatory filing, such as an FDA 510(k) summary. Dashed cells mean we searched and found nothing published. Each cell gives the metric and setting, the number exactly as the source reports it with its statistic, the reference device and number of participants, and a link to the source. If a study tested an earlier model, the cell says so. We never average results across studies or compute new statistics from someone else's data. For the chest strap and the ring discussed above, see the Polar H10 and Oura Ring 4 entries.
A good validation result tells you how closely a device tracked a reference in a specific group of people under specific conditions. It does not turn a consumer gadget into a medical instrument. Consumer gadgets are not diagnostic devices. If a reading worries you, talk to a clinician rather than relying on the number.
Sources
- The Lancet, 1986. Statistical methods for assessing agreement between two methods of clinical measurement; the paper that made limits of agreement the standard approach and argued against using correlation to judge agreement. PubMed 2868172
- British Journal of Sports Medicine, 2021. INTERLIVE Network expert statement and checklist for determining the validity of consumer wearable heart-rate devices. PubMed 33397674
- British Journal of Sports Medicine, 2021. INTERLIVE Network expert statement and checklist for determining the validity of consumer wearable and smartphone step counts. PubMed 33361276
- Sleep, 2021. A standardized framework for testing the performance of sleep-tracking technology, with step-by-step guidelines and open-source code. PubMed 32882005
- European Journal of Applied Physiology, 2019. Beat-to-beat interval signal quality of the Polar H10 chest strap and a Holter ECG recorder in 10 healthy adults at rest and during exercise. PubMed 31004219
- Sleep Medicine, 2024. Validity and reliability of the Oura Ring Generation 3 with sleep staging algorithm 2.0 compared with multi-night ambulatory polysomnography in 96 adults; authors report Oura Health financial support. PubMed 38382312
This feature is educational and is not medical advice. Consumer wellness gadgets are not diagnostic devices. If a reading worries you, or you have symptoms, talk to a qualified clinician.